Wearing two devices at once sounds like overkill. But when you want to know whether your wearable is telling you the truth, or just telling you what its algorithm wants you to see, running both was the test I was interested in. Here is what several weeks of simultaneous WHOOP and Oura data revealed.
This was my data building toward the Boston Marathon 2026. From December 2025 through March 2026, both devices ran simultaneously, capturing HRV, resting heart rate, sleep, and recovery metrics across the same physiology every night. The goal was straightforward: do these devices agree, and if not, why? At one point, I lost my Oura ring, resulting in a gap in the data.

Do the Devices Actually Agree?
For HRV, the answer is yes. During the six weeks where both devices captured comparable data, they tracked within 2 to 6 milliseconds of each other every week. For me this provided some comfort in knowing that each device showed similar data, regardless of whether that data is 100% accurate. This similarity allowed for some element of reliable data from baseline to continuous monitoring for me as an individual. Whether the data was valid (i.e., doing what it was supposed to do) is hard to say; my HRV drops very low with any form of exercise in a consistent pattern. These HRV drops are not signals that I am overtraining or require rest, rather, they are a consistent reminder that my HRV drops consistently when training. The drop is consistent and not worrying. I have not found a pattern or limit with my HRV regarding when to back off training. That has correlated better with subjective feelings of mood, energy, sleep and muscle soreness.
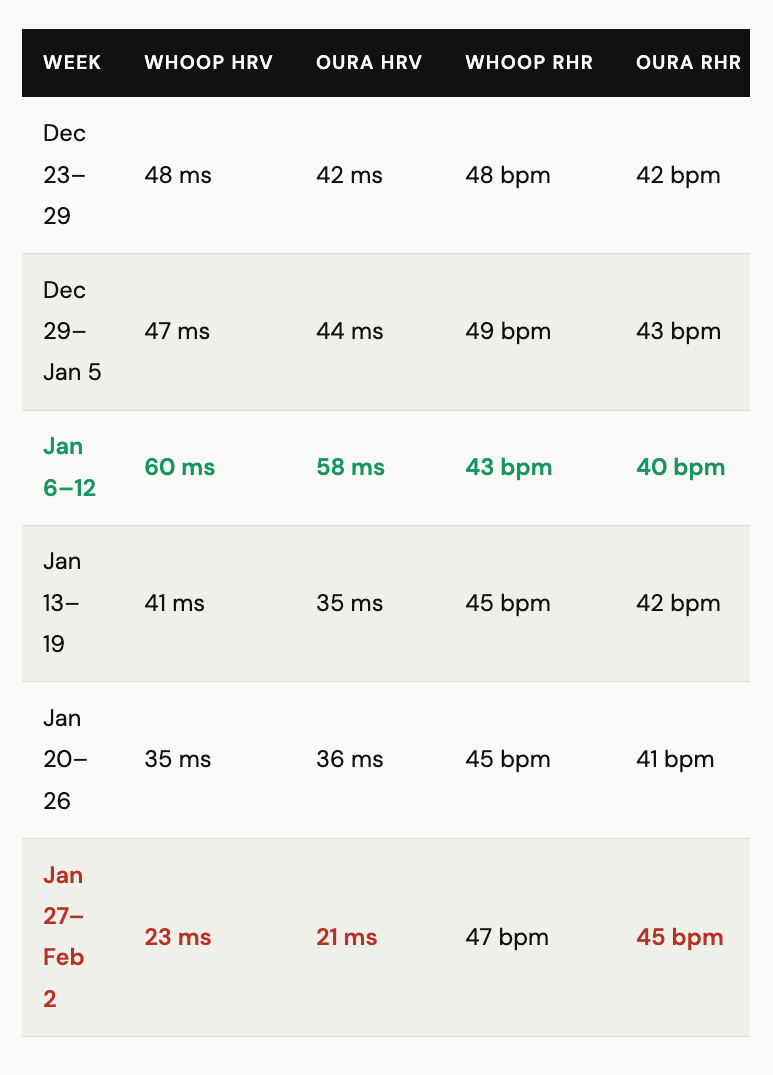
For resting heart rate, both devices tracked the same directional trend but WHOOP read 3 to 7 bpm higher than Oura consistently. This is not an error. WHOOP calculates RHR as an average across the full sleep window. Oura reports the overnight minimum. Both are consistent in their approach.. They measure different things and you need to know that before comparing them. My minimum heart rate has in fact increased this year compared to my previous four years of tracking on Oura. From a minimum of 36 back in 2022 to a graded increase of 1-2 bpm per year. This occurred despite my relative VO2max increasing from 54 to 58 ml/kg/min over the past few years, with a 1-2 kilogram bodyweight change. The absolute VO2 max increased from 4.54 L/min at 84 kg to the current 4.76 L/min at my current bodyweight of 82 kg. As I am aging, the resting heart rate appears to be increasing despite best efforts to maintain or increase fitness.
The January DownTurn
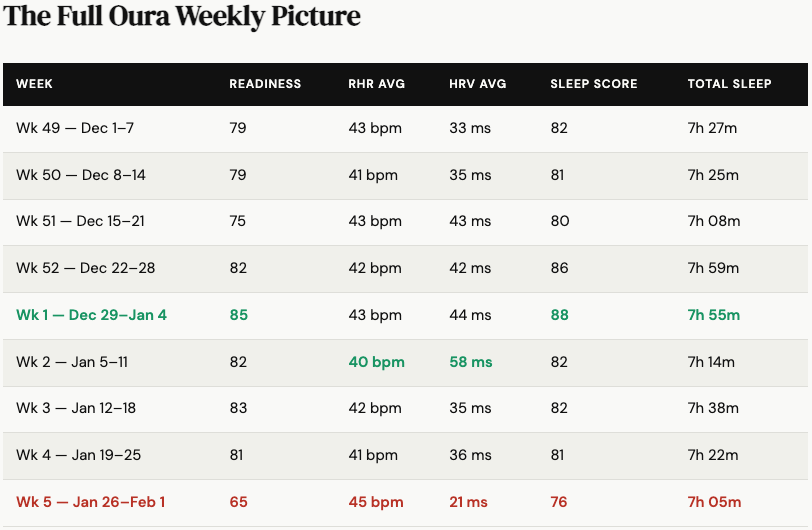
One interesting finding in the dataset is the late-January physiological crash. Between January 6–12 and January 27–Feb 2, HRV dropped 62 percent on WHOOP (60 ms to 23 ms). Oura registered the same event independently: readiness fell to 65, its lowest reading across nine weeks of data. HRV hit 21 ms. My sleep score dropped to 76. Every Oura metric bottomed out in the same week. However, this did not correspond to a noticeable change in training volume or intensity. Sickness did not occur, and training continued with little deviation from the original plan. There was a slight drop in volume, but it was early in the training cycle. Again, subjective feelings of mood, energy, sleep and muscle soreness better aligned with how I was training and adjusting that training. I was aware of the elevated heart rate and monitored it over a couple of days. It returned to baseline quickly.
When two independent devices, using different algorithms, sensor positions, and measurement windows, both register an event in the same week, it signals that the event was not noise. Hypothetically, a real physiological event was occurring. I was aware of the elevated heart rate and reduced HRV, yet I was not panicked. I observed what happened over the course of a few days while continuing to train. Knowing that my HRV regularly dropped to low values when training was in itself comforting to know I was not in a freefall.

For athletes in a high-volume training block, this kind of pattern could trigger a state of panic if you are not familiar with your data. For me, this was a reminder to use the data as a flag, but not necessarily take it as gospel that things are falling apart. I had the comfort of knowing that my nutrition and recovery strategies were solid and that it was likely a down turn rather than a complete bottoming out.

Sleep Debt
WHOOP's sleep need estimate averaged between 8 hours 3 minutes and 8 hours 51 minutes across the entire 16-week block. Actual sleep averaged 7 hours to 7 hours 57 minutes. That is a nightly deficit of 45 to 90 minutes, compounding every single day across my marathon build. This was unavoidable with a newborn and having another two children. Life is what it is and you have to fit training into life, not the other way around. The sleep requirement hours appear to become more realistic the longer you wear your WHOOP band. I have found that being aware of an increasing sleep debt and working toward reducing it through the start of the week helps me subjectively in terms of energy and mood. For me, this metric is one of the most powerful for creating change to one’s day.

WHOOP's sleep performance score looked good through much of this period, sitting at 83 to 92 percent. That number measures how efficiently you used the sleep you got. An athlete sleeping 7 hours against a need of 8.5 can still post a high percentage sleep performance. The score obscures the debt. Focus on the debt number rather than the composite score and see if that makes a difference to how you are feeling and the other numbers that might matter. Your Sleep performance score is a combination of the following metrics. The exact weighting is unknown yet it is not equal. It appears that sleep debt is not weighted as heavily as perhaps it should be. Sleep sufficiency & Sleep consistency are reported as the primary levers of the score yet perhaps consistency is weighted more.
1. Sleep sufficiency - hours slept vs Needed - creates the sleep debt value
2. Sleep consistency - how regular your bed time and wake up times are
3. Sleep efficiency - the percentage of time you are asleep whilst in bed
4. Sleep stress - difficult to understand exactly what is being measured for this metric
High sleep performance on WHOOP does not mean you got enough sleep. It means you slept efficiently relative to the time you allowed. Always cross-reference the sleep need vs actual hours column, not just the headline performance percentage. This is consistent with what I have found in other areas such as resting heart rate and total hours slept as well.
Key Learnings for Me, Other Athletes and Coaches
Both devices captured the same direction of change across every metric. HRV trends, RHR trends, and sleep trends all moved together on both devices during the same weeks. The signal is real. A reminder, similar to nutrition, remember to review the trend, not the number.
A 7 bpm resting heart rate gap between WHOOP and Oura is not necessarily an error. It is a methodology difference. WHOOP averages across the night. Oura reports the minimum. Know which number you are looking at before drawing conclusions or comparing to other athletes. One metric could be different simply because of the device being used. When HRV drops 60 percent over three weeks on a high training load, the first question is not, "Should I train through this?" It is "how am I feeling and what am I reporting?" In this dataset, sleep debt was visible every week from late January onward. This was the focus to correct and in doing so, I was able to continue training as per my plan.
WHOOP's sleep performance score could be a trap for high-volume or high load athletes. 90 percent performance with 7 hours against a need of 8.5 hours is not a win. It is a 90-minute nightly deficit dressed up as a good score. My recommendation would be to track the actual hours against the need, not just the performance percentage. Composite scores could be misleading to what you are driving towards - dive into the individual metrics that align with your personal needs and how you are performing could serve you better in the long term.
From a recovery standpoint, the weeks where HRV was lowest corresponded with the greatest gap between sleep need and actual sleep. During this time, reviewing calorie and carbohydrate intake during high-volume training had an impact on sleep quality and quantity. Energy availability is not a separate variable to recovery metrics. It can drive them. Remember that sleep and nutrition have a two-way directional relationship. Poor sleep can drive poor nutrition and poor nutrition can drive poor sleep. Conversely, the opposite can be said. So, if you are struggling with sleep or nutrition, do your best to improve both as it can have a positive impact ofn the metrics you are tracking.
My Fuelin Perspective
HRV suppression during a marathon build is not automatically a problem. It was expected. The question is the trajectory. A brief dip followed by recovery is normal in my case. Perhaps adaptation? The longer I track, the more accustomed I become to the data and what it means for me. A three-week slide with no rebound could indicate underfueling, undersleeping, or overtraining. It could be a combination of all three. These devices give you the signal. Fuelin gives you the nutritional response to act on it. Talking with your coach and using the data to implement interventions that create practical outcomes is always recommended as well.
Which Device Should You Use?
If you have to pick one, pick the one you will wear consistently and actually check. Both devices tracked similarly. The differences are in presentation, interpretation, and methodology, potentially not in the underlying data quality.
If you want the best picture of training readiness, WHOOP's strain and recovery framework is purpose-built for athletes. If you want richer sleep staging and a more conservative readiness estimate that factors in body temperature and HRV together, Oura delivers that.
If you are serious about performance and want to determine what works for you, run both for a month. Individual responses to training load vary. Use device data as one input alongside how you feel, your nutrition intake, and the context of your training week. Hopefully, this helped you think about your own data. Scott Use device data as one input alongside how you feel, your nutrition intake, and the context of your training week.
Hopefully this helped you think about your own data.
Scott